As a self proclaimed fitness nut, I was in for a shock when I realised I had missed 65% of my personal training classes over the last three months. I felt good, physically, but there was this nagging feeling that kept gnawing at me: ‘Ramya! Are you giving your 100%?!’
This led me to analyse my fitness calendar and do some ‘heavy lifting of the numbers’ a.k.a, a deep dive! Something felt amiss. Why was I missing classes? I woke up at the same time but my motivation to attend the classes was asleep. Also, my trainer had a rule: ‘No backsies on monies for missing classes’. The thought of losing money added to my guilt.
As I was about to give up, something made me check my bank statements. And there it was! The reason for my low attendance at the gym.
I quickly created a table to visualise my percentage attendance versus the mode of payment. During the months where I paid with my credit card, my attendance was lower. And the months where I used ‘cash’ or ‘UPI’ (An instant payment service in India), I was there at the gym with >90% attendance!
This is the magic of data storytelling. Where you are playing detective with numbers and are solving the ‘curious case of disappearing profits’ or the ‘case of low gym turnouts’. If you are a data nerd like me, data storytelling is a great skill to have. Not only will you get to dance with numbers, but you will also get to take them out on a date and have a great time.
What is Data Storytelling?
If you can turn raw, complex data into narratives and insights- cheers to you! You are a data storyteller! Organisations are sitting on a goldmine of information. Information, which, if translated into insights, can help make their businesses more efficient - transforming their sales performances, customer services experience, branding approaches etc.
The goal of data storytelling is to help stakeholders or audiences (mostly from a non- technical background) to understand what the data entails and make smart decisions. The stories provide context and colour to complex data and help highlight trends and patterns that ultimately help solve problems.
You might wonder if data storytelling is the same as statistical analysis. The answer is No!
As beautifully referenced in this article. While both aim to dig deeper into the data - statistical analyses leverage complex methods and can mostly be understood by stakeholders with technical knowledge, while data storytelling aims to convert these complex findings into relatable and engaging stories. This Stanford Professor conducted a study and found that 63% could recall presentations that had data storytelling as a component, as opposed to only 5% of students that recalled presentations based on statistical analysis.
Real-Life examples of Data Storytelling for business.
Operations Efficiency
Let’s take an example of a popular supermarket chain’s dilemma. During their Quarterly Sales analysis, the owners were unsure as to why their Snacks’ sales were dipping. They roped in analysts to deep dive into their data. After analysing the numbers along with visual heatmaps, the analysts were ready with the data story. The customers were skipping the snacks aisle during peak times as it was located in a crowded corner. The analysts suggested changing the layout. This simple change increased the snacks sales by over 30%!
The data storytelling here helped present numbers and visual heat maps into digestible insights. This made the problem obvious and solvable. What a great way to convert the ‘whys’ into ‘wows’!
Sales and Marketing Strategy
A vegan ice cream shop in Toronto was the town favourite. They noticed that sales went down every July despite summer being their peak season. Their business analysts got to work and analysed the raw data. After much number crunching and analysis, the analysts discovered a pattern. July was the summer lovin’ month. But it was also the month when their city faced extreme heat waves, making people reluctant to step out.
With this insight, the company marketed home-delivery promotions during the hottest days, thus boosting sales by 25%!
Data storytelling helped visualise the customer behaviour and helped reveal the hidden reason behind declining sales.
Client Engagement
A fitness app developer was made aware that their users were downloading the app but not following through with their fitness plans. This led to fewer purchases, but data storytelling came to the rescue! The analysts dug deep into heatmaps and raw data and the result was quite surprising!
The users were not too enthusiastic about the complex workouts and dropped out before reaching goals. The suggestion was to break down the user’s fitness goals into smaller and/or personalised workouts. This change saw a 40% improvement in user retention.
The process of data driven decisions highlighted the break points where users were most frustrated and dropped off. Thus helping companies to make design changes to help with their goals and engagement.
Customer Service
The customer service team noticed a 25% increase in complaints compared to the previous quarter. Data driven visual storytelling helped understand that this was due to a recent change in service hours. Customers were not too happy as the hours were incompatible with their personal schedule.
A readjustment of employee-shifts back to hours which were preferred by the majority of customers reduced complaints by 35% and improved customer satisfaction.
Data driven decision making clarified customer issues and led to service quality improvement.
The Power of Data Storytelling: Turning your ‘Whys’ into ‘Wows’
Leveraging the power of data storytelling along with data analysis and visualisation helps companies bring in efficiencies in several ways.
The 2 Cs: Communication and Collaboration
If you have watched the movie ‘Margin Call’, during one tense scene titled ‘Senior Partners Emergency meeting’, the big boss, Mr Tuld, played by legendary actor Jeremy Irons asks the analyst, Peter Sullivan, to speak to him in simple English or as a ‘young child or a golden retriever’. A perfect example where the associate dissects the impending risks and issues in a simple language.
Data storytelling bridges the gap between technical and non-technical teams. The message and insights are easily digestible. Decisions can be made quickly. This saves a ton of time to everyone involved.
The 2 Ds: Data and Decision
In the same scene, the analyst, Peter Sullivan starts off with the issue at hand. The risks and challenges that the firm foresees. He provides good data points in simple language and paints a picture of the dire situation the firm has landed in. The rest of the movie is a nail biting drama of the decisions made by the big boss to get the firm out of the soup they landed themselves in.
Data Storytelling bridges gaps between the technical and non technical teams. The message and insights are easily digestible. Decisions can be made quickly. This saves a ton of time to everyone involved!
The 2 Is: Impact and Innovation
Data Storytelling encourages individuals to simplify complex data points into simple digestible facts and bites. The higher you move up the career ladder, the simpler language you must choose to speak in. While presenting to a senior manager/ C-suite individual, it becomes imperative to move away from the technicals and be adept in crafting a story by painting a picture by using the power of data.
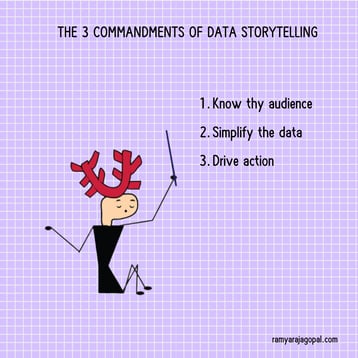
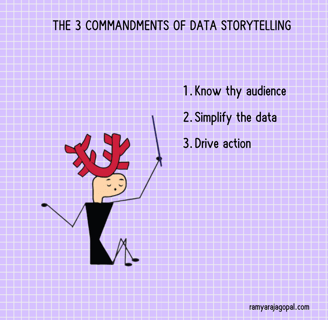
The 3 commandments of Data Storytelling
To craft compelling stories out of data, it is important to choose the flavours that work for you. As a data storyteller, I swear by the 3 commandments that always make me KISS (Keep It Simple Silly)
Commandment 1: Know thy audience
Always ask yourself: Am I presenting this to a senior stakeholder or a mid level manager? The higher the hierarchy of your stakeholder, the simpler the message.
My first job was at an Investment Bank. As a second year finance analyst, I had an opportunity to present my data heavy project in front of my Managing Director. This was a career defining moment for me. I was leading a complex global project and there was so much data to process and showcase. I remember walking into the room and presenting it to him and yes, he was not too impressed because my slides were text-heavy and visually unappealing.
In another meeting, another senior analyst presented data in Tableau (A data visualisation BI tool). My Managing Director enjoyed the presentation as it was all in graphs and he was able to digest it.
Lesson learnt: Know your audience and tailor your message accordingly. This one simple meeting changed the way I looked at data as a project manager and data analyst.
Commandment 2: Simplify the data
Chop down your insights as you would chop up your onions. (sans the tears of course). Over time you will definitely love simplifying everything around you!
During my decade long work experience in the world of data analysis, I have realised that choosing what is useful to the stakeholder takes precedence over presenting the entire dataset. I had to delete so many pretty graphs as they were irrelevant to the subject/topic/story of my presentations to the stakeholders. Of course one can always have an appendix section in case you are overly attached to your work.
Commandment 3: Drive action
Ask yourself, will my insights help drive decisions and action? Did I do justice in simplifying the data? You need your stakeholders to walk away with confidence that they have all the necessary information in hand and can make a decision on the back of it.
In the same scene from ‘Margin Call’, the partners walked away with enough insights to go and make decisions in order to save their firm from bankruptcy.
In Conclusion
Data storytelling turns your spreadsheet into an Oscar worthy Hollywood script. Just like the movie “The Big Short” - where they explain the housing crisis using Jenga blocks. How did it help? By breaking down complex topics into engaging and relatable visuals, everyone—data geeks and decision-makers alike— found it easy to understand and were able to act quickly. Thus, turning awkward silences into clear, actionable insights.
Here is the catch! It is not a one person show. Your company needs the right tools to learn and implement. Collaborate with me to understand how data storytelling works and simplify your processes, solve problems quickly and leverage the power of data to its maximum potential!
#DataStorytelling #Data #DataAnalytics #Stories